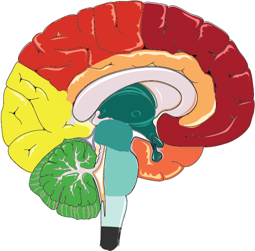
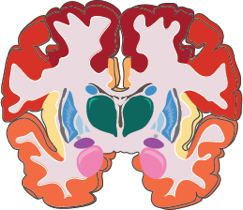
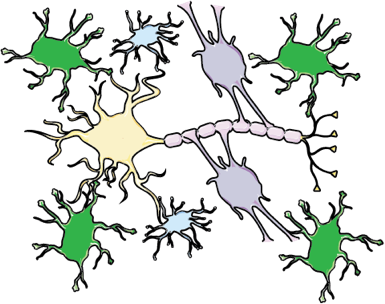
Please select a CNS region and cell type to see the top 50 genes ranked by expression fidelity, along with associated data on absolute expression levels, loss-of-function (LoF) mutation intolerance, literature citations, and protein-protein interactions.

Cell types


Species: CNS region: Cell type: Datasets: Samples:
Expression fidelity (blue track) is a z-score that quantifies the extent to which the expression pattern of each gene was correlated with the inferred abundance of the cell type over all queried samples.
CNS expression (red track) is an average of the expression percentile ranks of each gene over all queried CNS regional datasets.
LoF intolerance (black track) is the probability that a given gene is intolerant to loss-of-function (LoF) mutations. Data are from the Exome Aggregation Consortium.
PubMed citations (green track) is the number of citations in PubMed returned by queries for each gene symbol plus the name of the cell type.
PPI (interior lines) denote protein-protein interactions (PPI) from the STRING database.


